Canvass
A lightweight canvassing app for grouping neighborhoods, tracking canvassed addresses, and giving field volunteers a simple map and address list to work from.
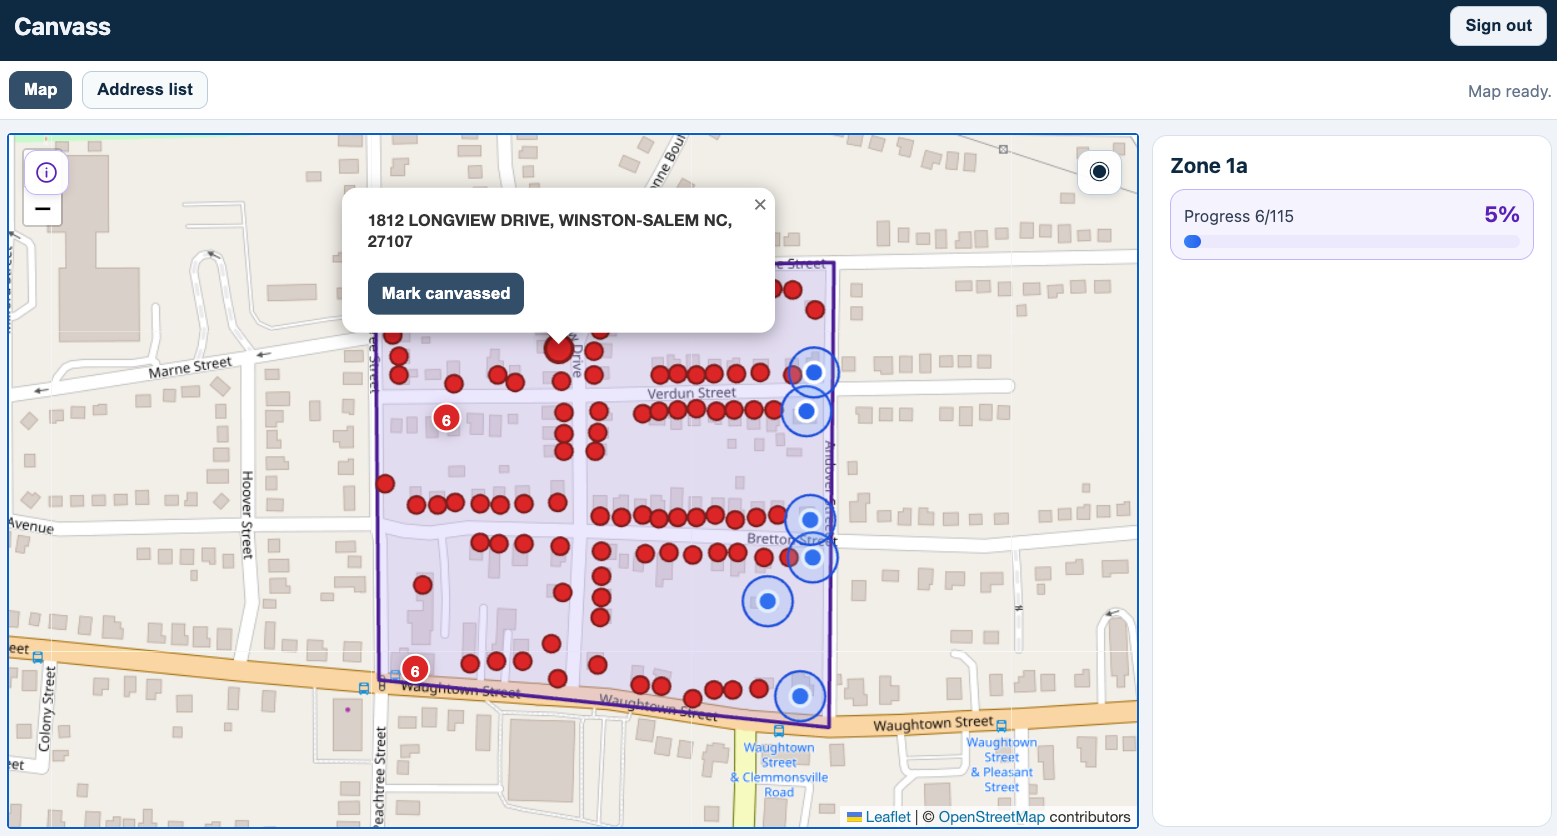
Canvass was built to make local canvassing more organized and visible. Admins can draw geofenced areas on a shared map, assign them to users, and track progress. Canvassers can sign in, see only the areas assigned to them, and mark addresses as canvassed from either the map or a grouped address list.
Project Snapshot
Type: Progressive web app
Built with: React, Supabase, Leaflet, Netlify
Purpose: Canvassing coordination
Core features: Geofences, shared map, grouped address list
The Problem
Local canvassing gets complicated fast. Addresses often live in spreadsheets. Area assignments happen in conversation, and it becomes hard for organizers to tell which neighborhoods have been worked and which have not.
I built Canvass to solve that in a simple way. Instead of relying on disconnected tools, the app gives admins a shared map of addresses, lets them assign areas to specific users, and gives canvassers a clear view of what belongs to them.
How It Works
Admin Tools
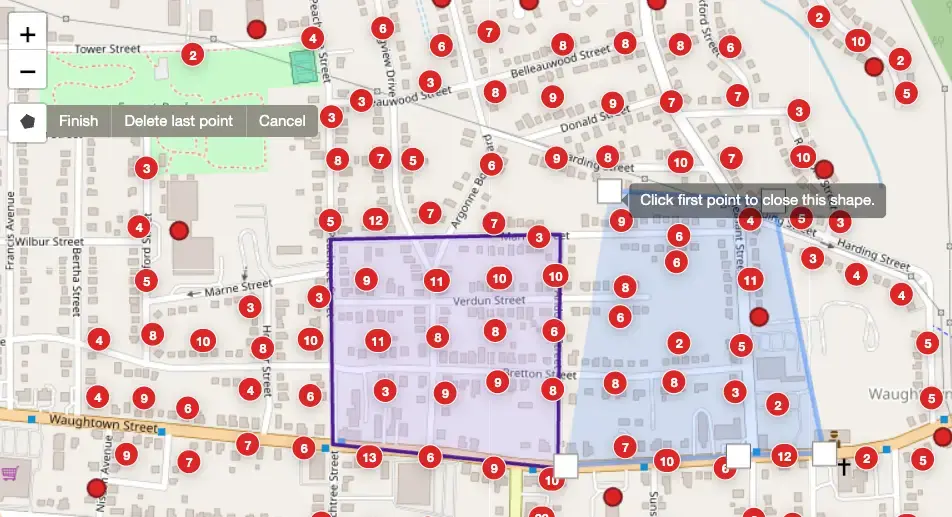
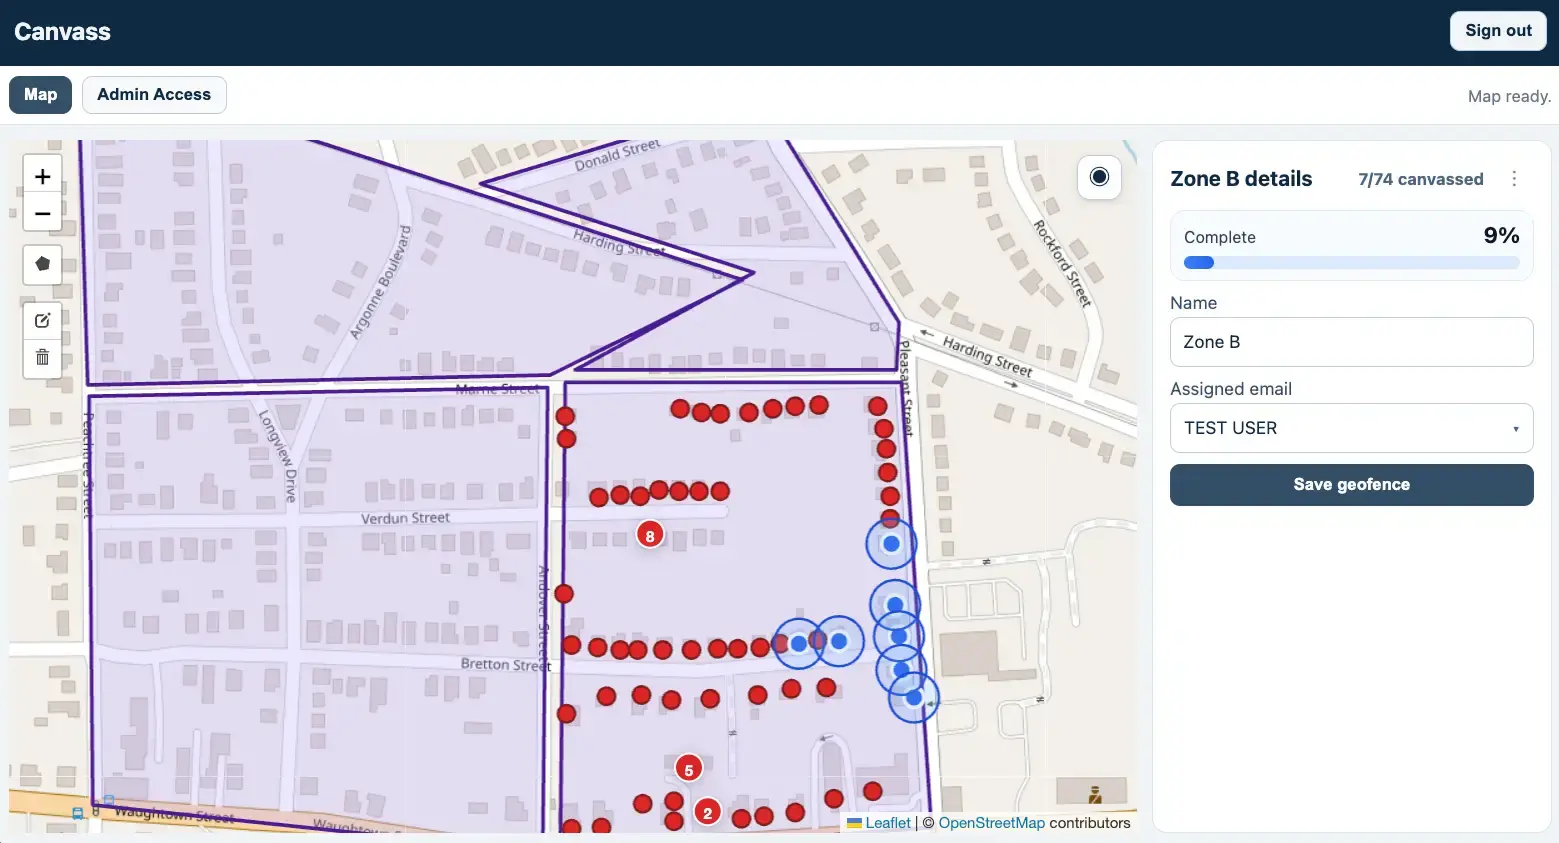
Admins use the map to create and manage work areas. A geofence can be drawn around a neighborhood or subdivision, named, and assigned to a user by email. From there, the admin can see that area's progress and manage access without relying on separate spreadsheets or messages.
Canvasser Map
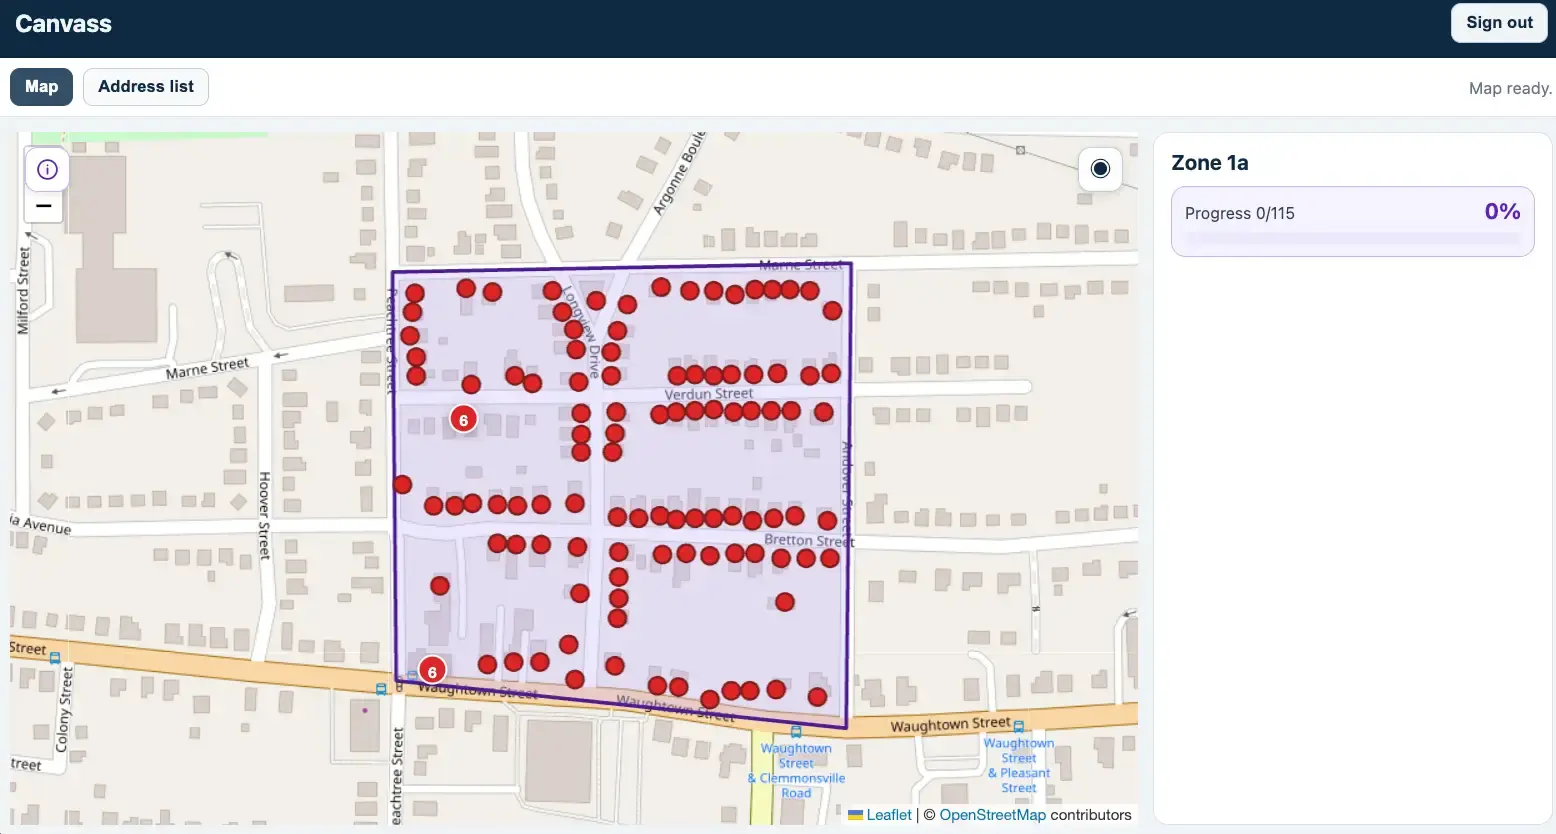
Canvassers sign in and see a full map with their assigned areas clearly highlighted. Address points inside those areas can be marked as canvassed. Outside areas stay visible for context, but the working area is what stands out.
Address List View
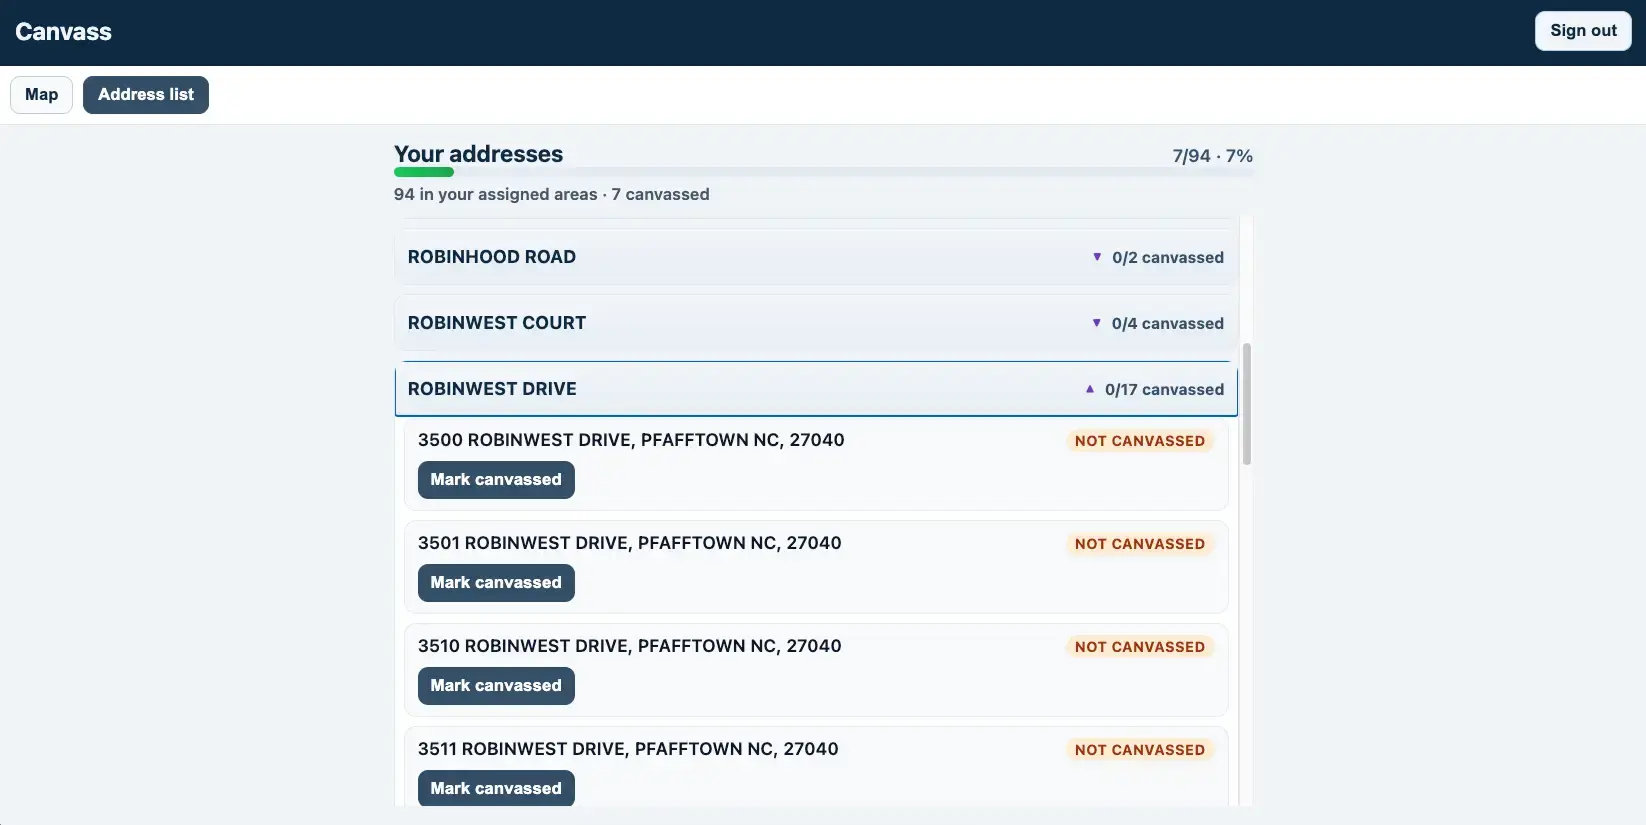
The app also includes a grouped address list so canvassers are not forced to rely only on tapping map points. Addresses are grouped by street, progress is shown at the top, and a user can expand a section and mark addresses canvassed directly from the list.
UX Decisions
This project became just as much about usability as it was about mapping and data.
One of the first issues was touch accuracy. When many address points are close together, a dense map becomes hard to use on a phone. To make that workable, grouped markers help reduce clutter, and the address list gives canvassers a second way to move through an assigned area without fighting the map.
Another major consideration was visual clarity. Assigned areas needed to stand out clearly against the base map, and color choices needed to work better for red-green colorblind users. That led to refining how geofences and status states were shown so the interface was easier to read at a glance.
I also cut back on unnecessary metrics. Instead of filling the UI with repetitive numbers that do not add much, the design focuses on the progress information that is actually useful while someone is organizing or canvassing an area.
Stack and Architecture
Canvass is built as a React and Vite progressive web app hosted on Netlify. Supabase handles authentication and data storage, including address points, user profiles, and geofences. Leaflet and OpenStreetMap power the mapping experience, with GIS-derived address data imported into the database and rendered as interactive map points.
The app uses role-based access so admins and canvassers see different controls, while still working from the same underlying map and address data.
Reflection
This is the kind of project I enjoy most: operational software that has to be useful in the real world.
It combines GIS data, role-based permissions, map interaction, mobile-first thinking, and a real local use case. It also forced good product decisions. A dense map alone was not enough. A field tool like this needs multiple ways to work, clear assignment boundaries, and an interface simple enough for people who are not technical.
Canvass pushed me to think through the gap between raw data and usable software. Importing thousands of addresses is one problem. Turning that into something a real person can use while out in the field is a different one.
The most valuable part of building it has been working through those practical details: how to assign work clearly, how to make dense map data usable on mobile, and how to keep the experience simple enough that the tool helps rather than slows people down.